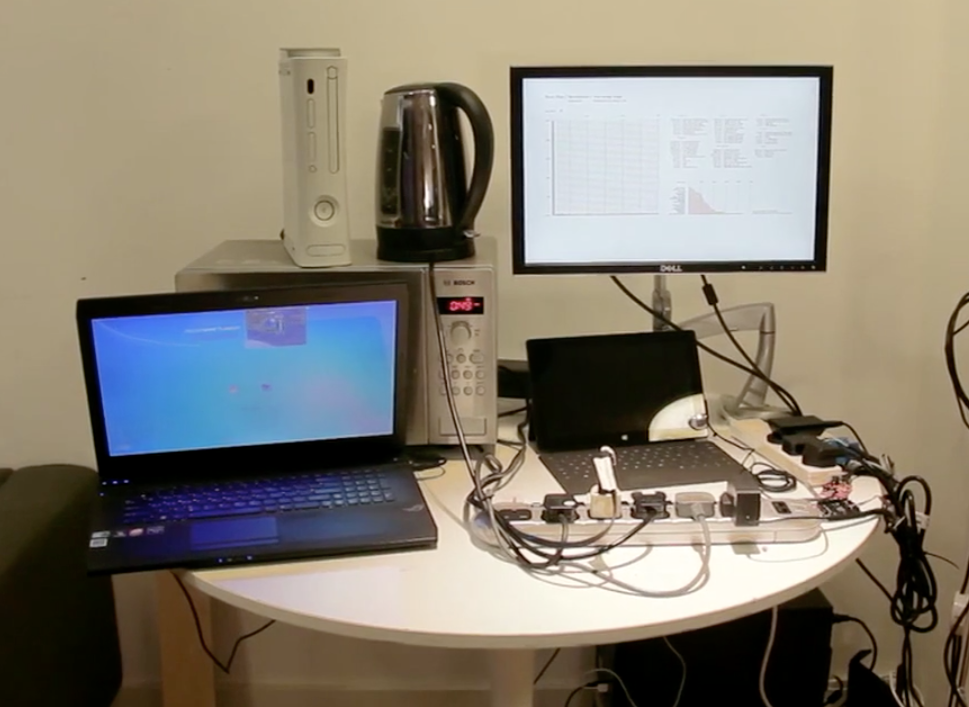
A way for home users to monitor electrical usage live and compete against others to be the most environmental
I've always tried to be conscious of how much I consume in terms of general amenities. However, even though most of us have regular access to our usage, it seems we are happy to focus only on price when reviewing our statements. Perhaps this is because of the way usage is displayed i.e always in points/units, but what does this usage mean? well, generally nothing to most people as there is no understandable comparison or context in term of use.
I wanted to provide context and create something people could use to understand their footprint. Therefore, I knew for the usage to resonate with people and for them to understand there needed to be a human connection.
The daily energy used to boil your kettle could light your home for a week…
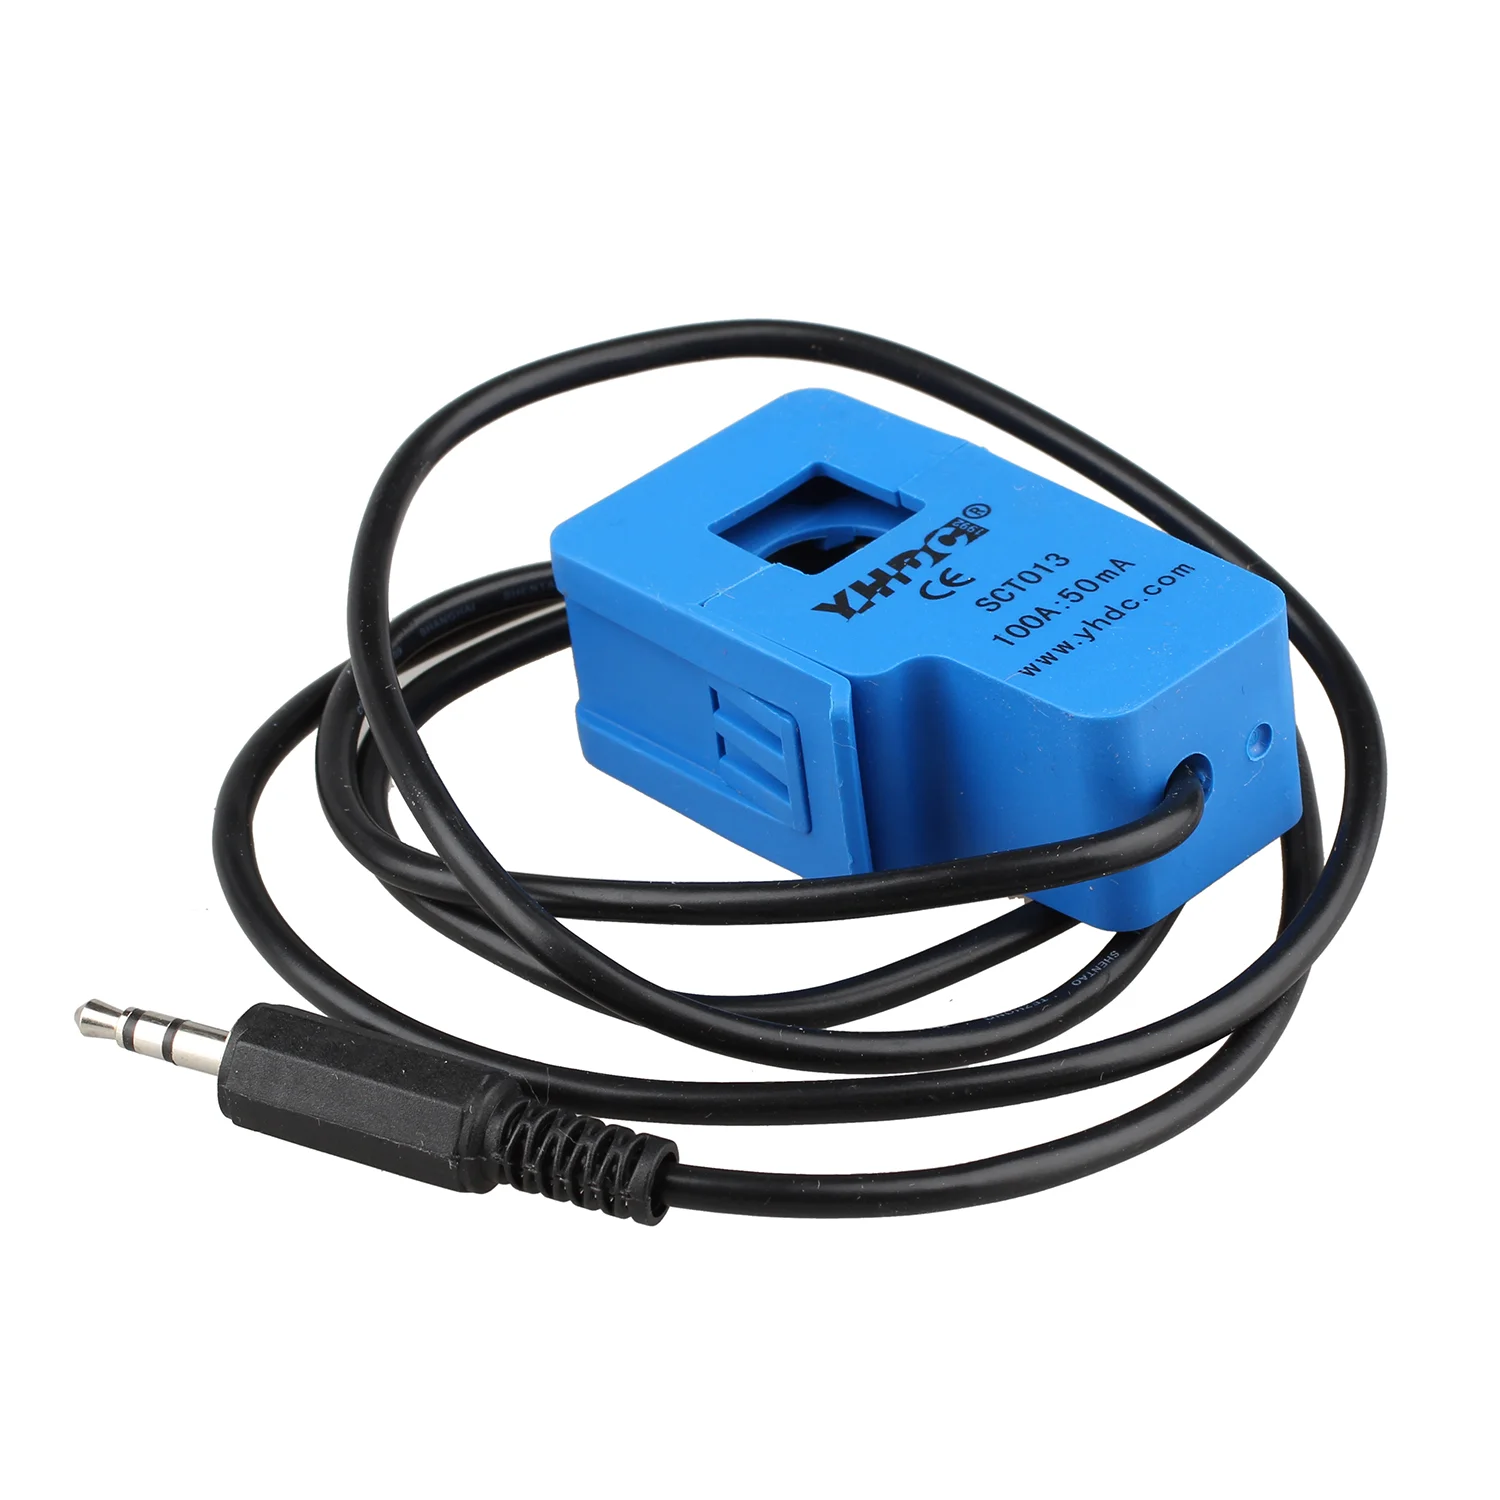
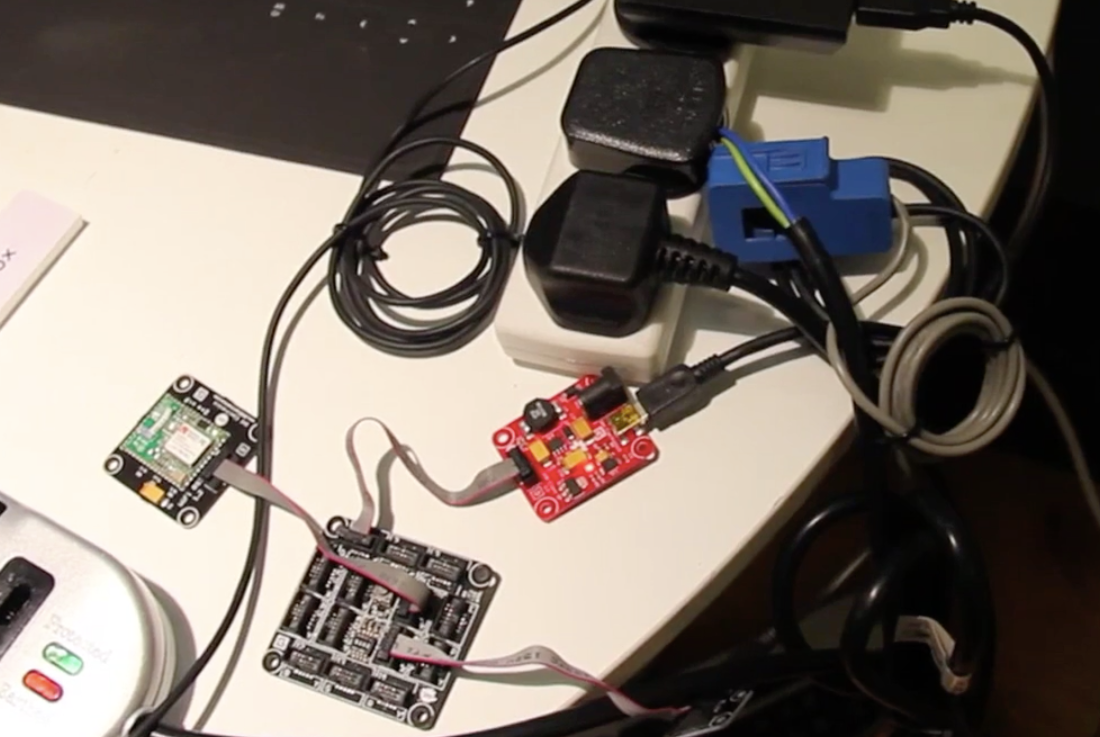
At the time I was working with Microsoft's .Net gadgeteer platform, so I started investigating power consumption and how to measure it. With some research I found a sensor called a CT Transformer which when hooked into a microcomputer could report on usage/demand (depending on the CT range, different power ranges).
CT Sensor's work by detecting the Alternating Current (AC) through either the live or neutral wires in a traditional electrical cable. In-expensive and requiring minimal electrical work, they seemed an ideal way of calculating usage. I won't go into the maths of it all but you can understand more here.
Albeit a bit bulky, I believed this would be a good basis for a device that would facilitate home reading & energy consumption reports, supported by an online account, the data could be used in all manner of ways.
This was always going to be a prototype so I used a low 30A sensor (you can get up to 100A). I wanted this to be a consumer platform therefore considering a kettle uses between 8 - 10 amps the 30A sensor would be suitable. Wiring up to the Gadgeteer was relatively simple and once I calculated AC to wattage it enabled me to have the working unit up and running.
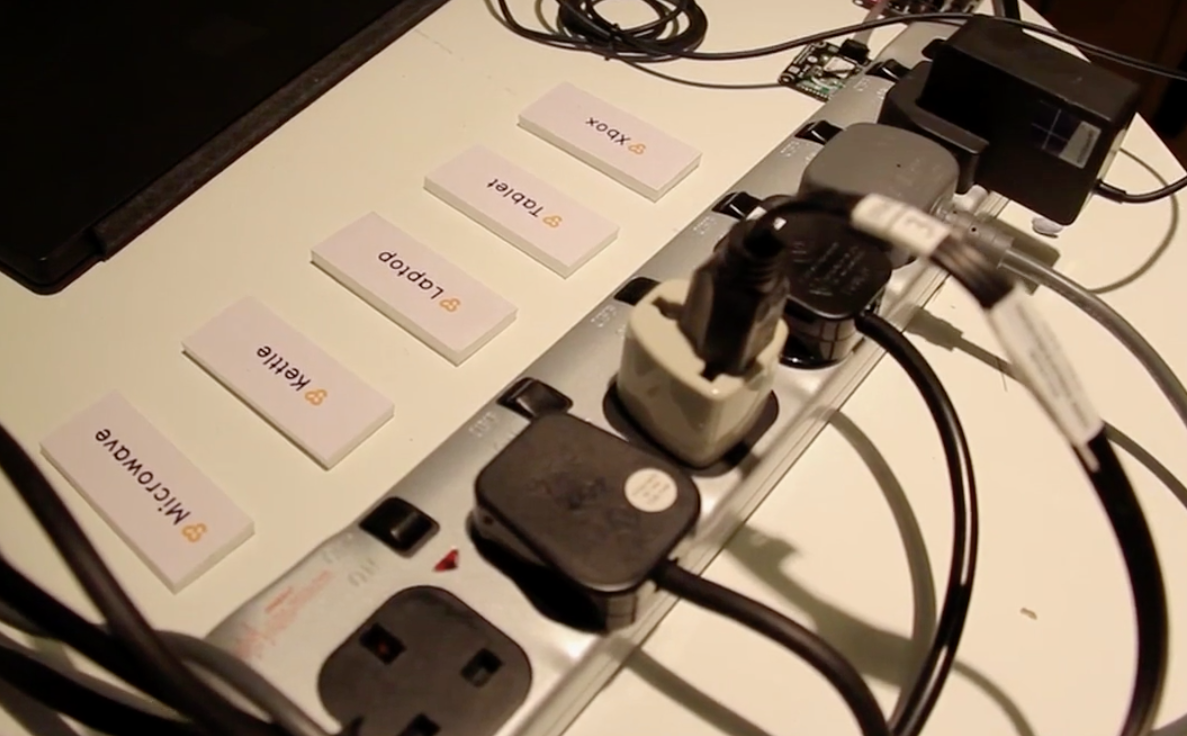
As the AC runs through the live and neutral wires, I had to splice the cable of the appliance I was testing to clamp a single wire, because if the whole cable was clamped you’d be unlikely to get a reading.
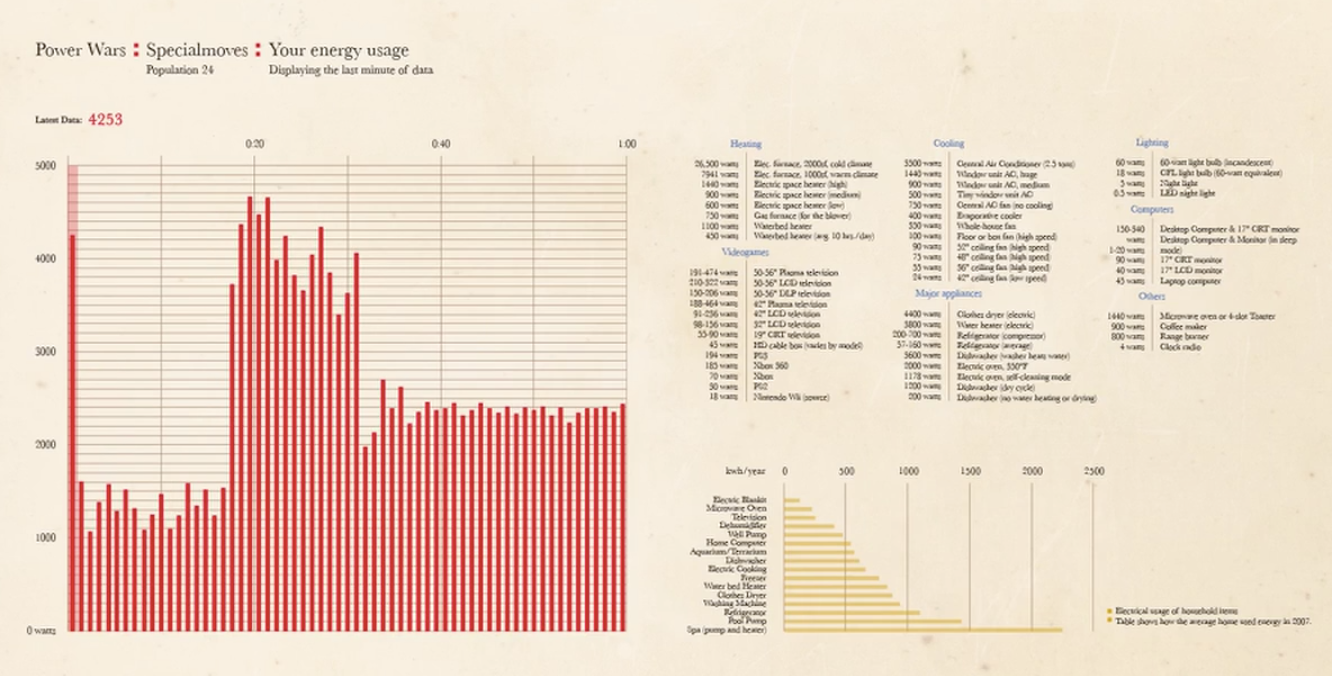
It only took a few hours to get usable data back from the CT Sensor via the gadgeteer, so I then reviewed libraries to finds ways of displaying the content effectively. I chose a relatively new project called D3JS which allows data to be displayed via HTML, SVG and CSS. I sent all data via a wifi module and Web service to a website which then displayed it via multiple graphs using the D3JS library. The result being you could view a live stream of the electrical consumption of any appliance, rather than awaiting a monthly report.
It was enormously rewarding to see the charts actually show electrical spikes as I tested turning on and off devices, it highlighted the difference in certain appliances demand.
But why stop at just providing more usable data, how about trying to get people actively saving power? The main part of the the project was to make the platform networked. Massively inspired by Usman Haque's 'Natural Fuse' I wanted to pitch consumers, business' and perhaps even countries against each other in trying to save electricity.
With a working prototype and data being sent over wifi to my server, I started to think about the different features of the website and also the physical device. This would still be very different to the approach of current devices, many exist, however none provide any real tangible understanding of usage, it’s still reported in units/points or kHz.
Online Features
Live Data – A live 'real-time' graphic displaying current office demand (usage).
Comparison - Other units/users/buildings/average statistics
Cumulative data – A static graphic displaying users weekly/monthly/yearly usage
Milestone Data – Allows setup of usage target, shows current status
Battle Data – comparison of locals? County, country, capital
Leader boards – Most efficient user/company?
Social networks – Sharing monthly/weekly outgoings
Global map – Showing most efficient areas/companies
The Future & Gamification
New plugs - Replacing normal plugs with CT plugs that use your home network to report individual device consumption.
Battles (user) - Setting challenges and by saving you are rewarded with points/credits to be spent in fortifying your game world?
Teams (Regional) - National/international based comparison. Lewisham v Wandsworth, London v Paris, UK v France etc....
Control - A grid based game, over pre defined locals. Work with neighbours or against to gain rewards. Better rewards for combined work within a local against another.
Badges - Officially recognised green company/user, Partnering with environmental agencies for improving position.
Remote Control - The plugs are already connected, providing switches for controlling of appliances?


